26/27 New Feature: Regression Dashboard
The Regression Dashboard will look familiar to the OG Elite Fantasy Basketball subscribers. Back in the day, I used to wake up and scrape the NBA.com page for a variety of stats that I would then plug into an Excel spreadsheet. The spreadsheet would compare a player’s current numbers to their previous season(s)’ numbers, which made it easier to figure out why a player was underachieving or overachieving and whether that improvement or regression was sustainable. NBA.com eventually put an end to that.
I’m bringing it back this year. This will be a tool I lean on heavily during the regular season when I’m putting together the daily Box Score Analysis. The tool works just like it did in the past, but now it has more bells and whistles.
The tool lets you compare a player’s current numbers to either last season’s numbers or their combined numbers over the prior two seasons (weighted by games played). Counting stats are compared on a per-36-minute basis, so changes in playing time don’t skew the results.
The stats tracked by the tool are:
- USG%
- FG%
- FGA36
- 2P%
- 3P%
- 3PAr
- FT%
- FTAr
- FTA36
- PP36
- 3P36
- RP36
- AP36
- SP36
- BP36
- TOP36
As is the case with all the tools, the Regression Dashboard will update shortly after each game finishes.
Here is a screenshot of the tool. The data that is currently in the tool is from the preseason games. Once the regular season starts, the tool will populate with the regular season numbers.
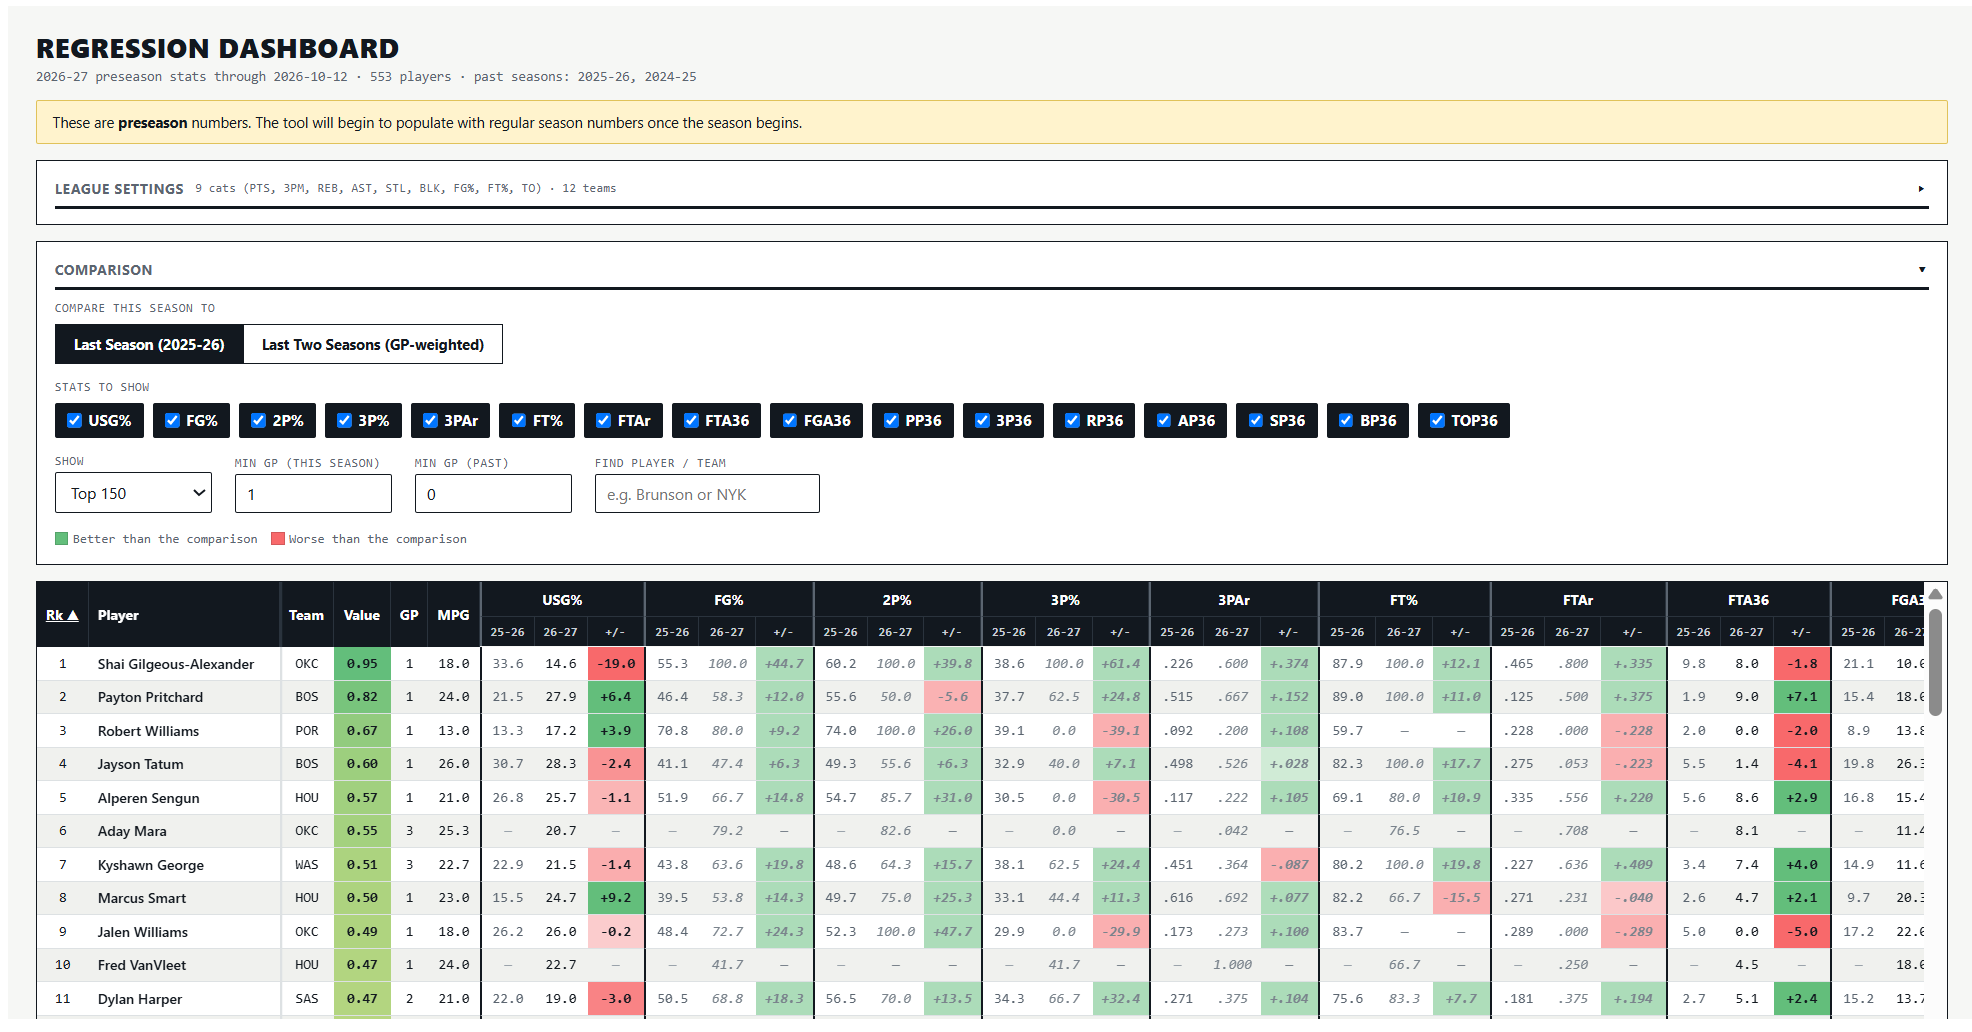
The Regression Dashboard is available to both Draft Season and Full Season Subscribers. It will be available to Regular Season subscribers once the Regular Season subscription option is made available in November.
Regression Dashboard
For access to all of this year’s punting guides, projections, rankings, pairing guides, sleepers and busts, and much, much more, subscribe here: